

In almost 20 years, many specific calculations have been carried out and a great deal of experience gained.
"The noblest pleasure is the joy of understanding" Leonardo da Vinci

Below are some examples from Climate3 publications. Thanks to the process expertise anchored in the Climate3 LCA, practically all sectors can be calculated.
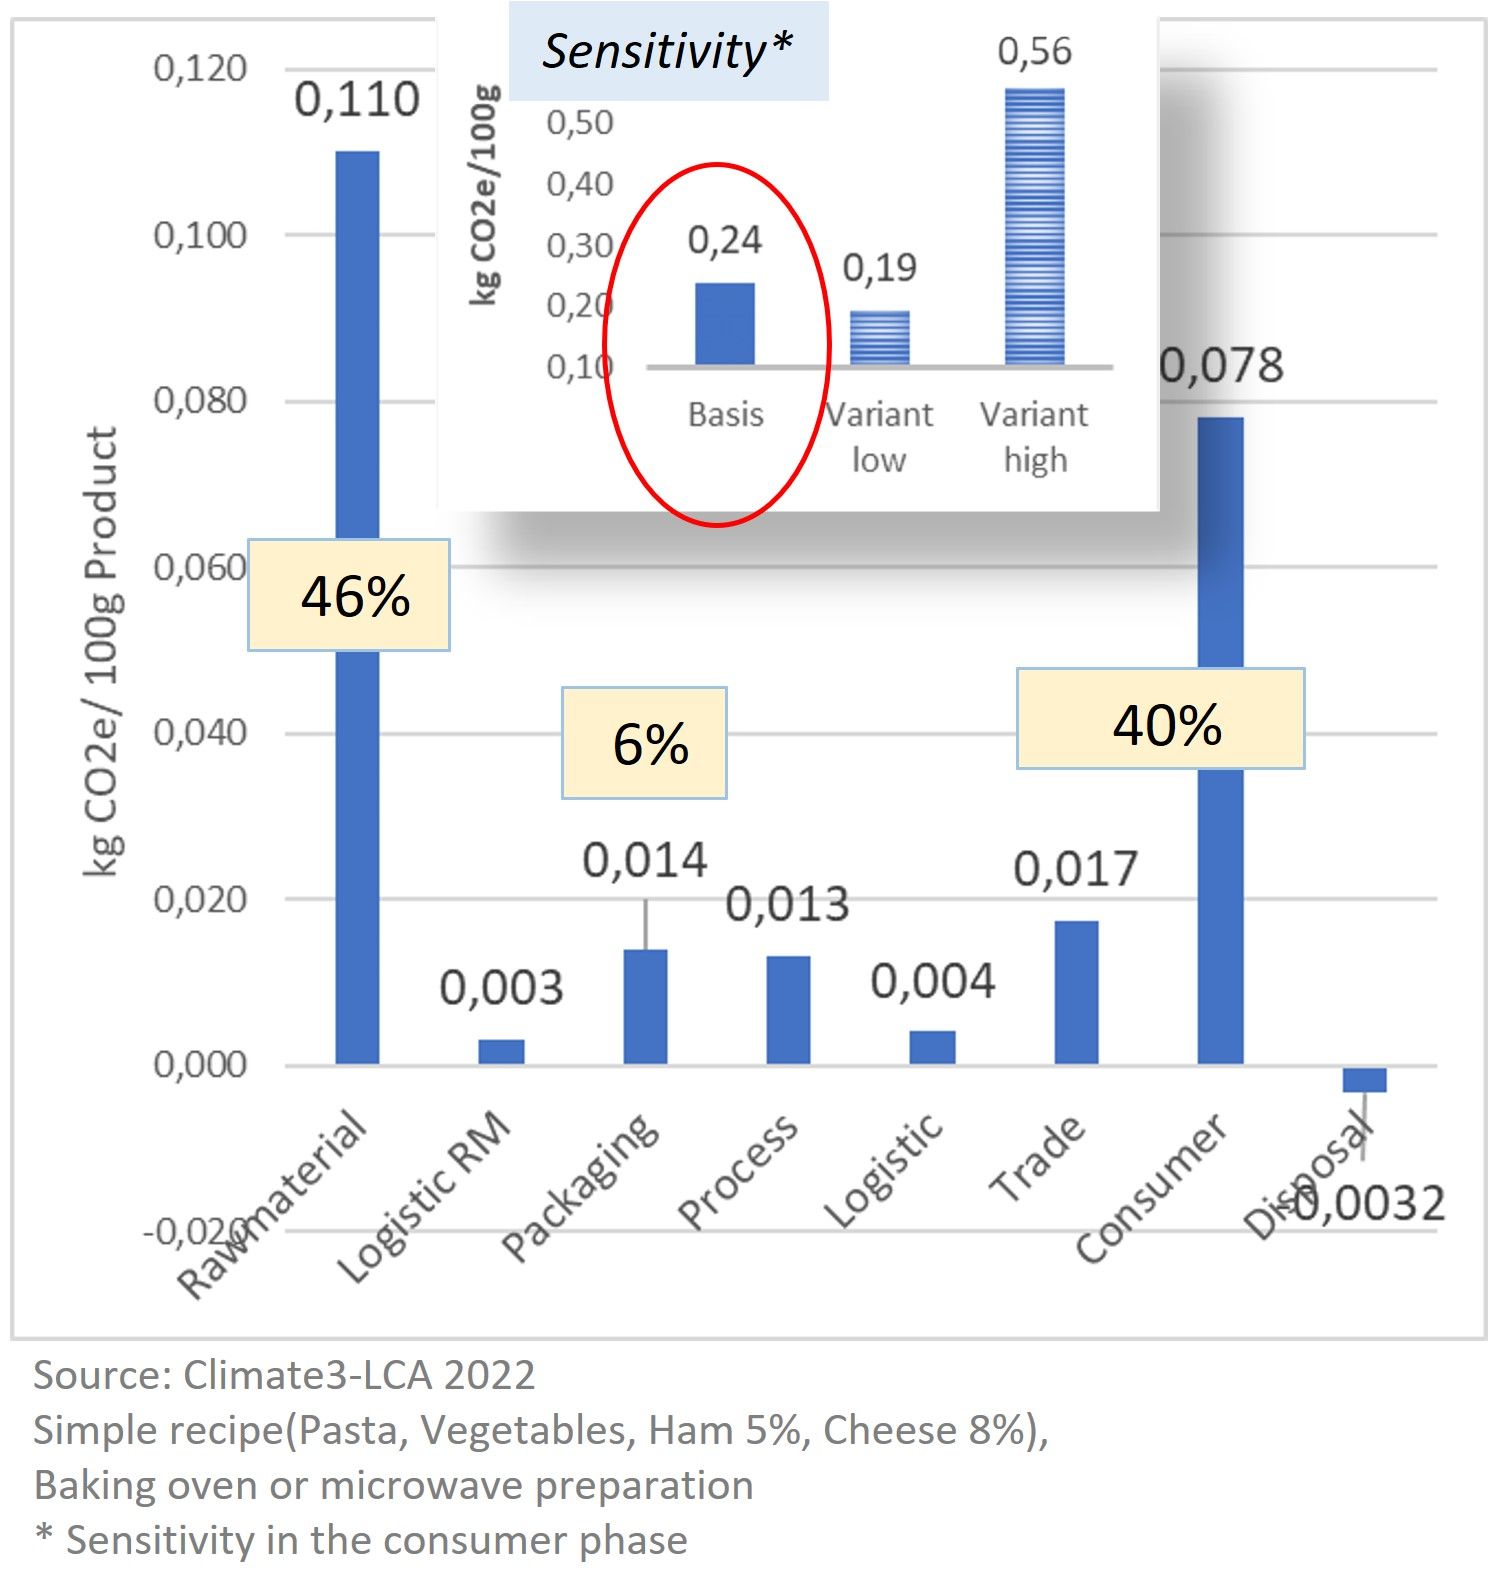
Typical PCF of a product using the example of a foodstuff
The study analysed a pasta bake for microwave or oven preparation (large graphic). It is interesting to note that the CO2e emissions:
- approx. 46% come from the supply chain
- but 40% also come from the consumer phase
- approx. 5-6% of the PCF comes from packaging and the company's own processes
In the sensitivity study (small graphic), purchasing behaviour and the type of preparation were varied. The astonishing result: the consumer's area can be more important than the supply chain.
It is important to calculate all life cycle phases of the product and carry out sensitivity in order to obtain conclusive results

Disposal of packaging
Climate3 conducted in-depth studies to show the correlations in disposal. Using the example of PE plastic, the graph above first shows the recycling of PE with the assumed rate of 47.1% as a credit of 1.38 kg CO2e and directly next to it the credit from the incineration of 1.63 kg CO2e / kg of PE disposed of.
However, the incineration of PE also produces CO2e emissions of 1.60 kg CO2e. It follows that the incineration of waste makes no sense compared to recycling. The credit and the emission cancel each other out.
Climate3-LCA automatically calculates the new results if the recycling rates change.

Calculation in mechanical engineering
The image above shows the product carbon footprint of a new example mixer with a value of 2,172 kg CO2e/machine (green bars). The mixer should be replaced after 5,000 operating hours.
The mixer could be rebuilt and result in the same PCF (green). Alternatively, the core of the mixer could be retained and the seals, electric motor and the entire electronics with control system could be brought up to date. The result of the PCF of the renewed mixer is 542 kg CO2e/machine. So 4 times less!!!
The graph below shows the result of the life cycle assessment for this comparison. In addition to the expected advantages for resource consumption, clear advantages in biodiversity indicators become very clear.
Mapping such calculation variants is a simple process in Climate3-LCA. The LCA modelling of a renewed machine only takes a few minutes.
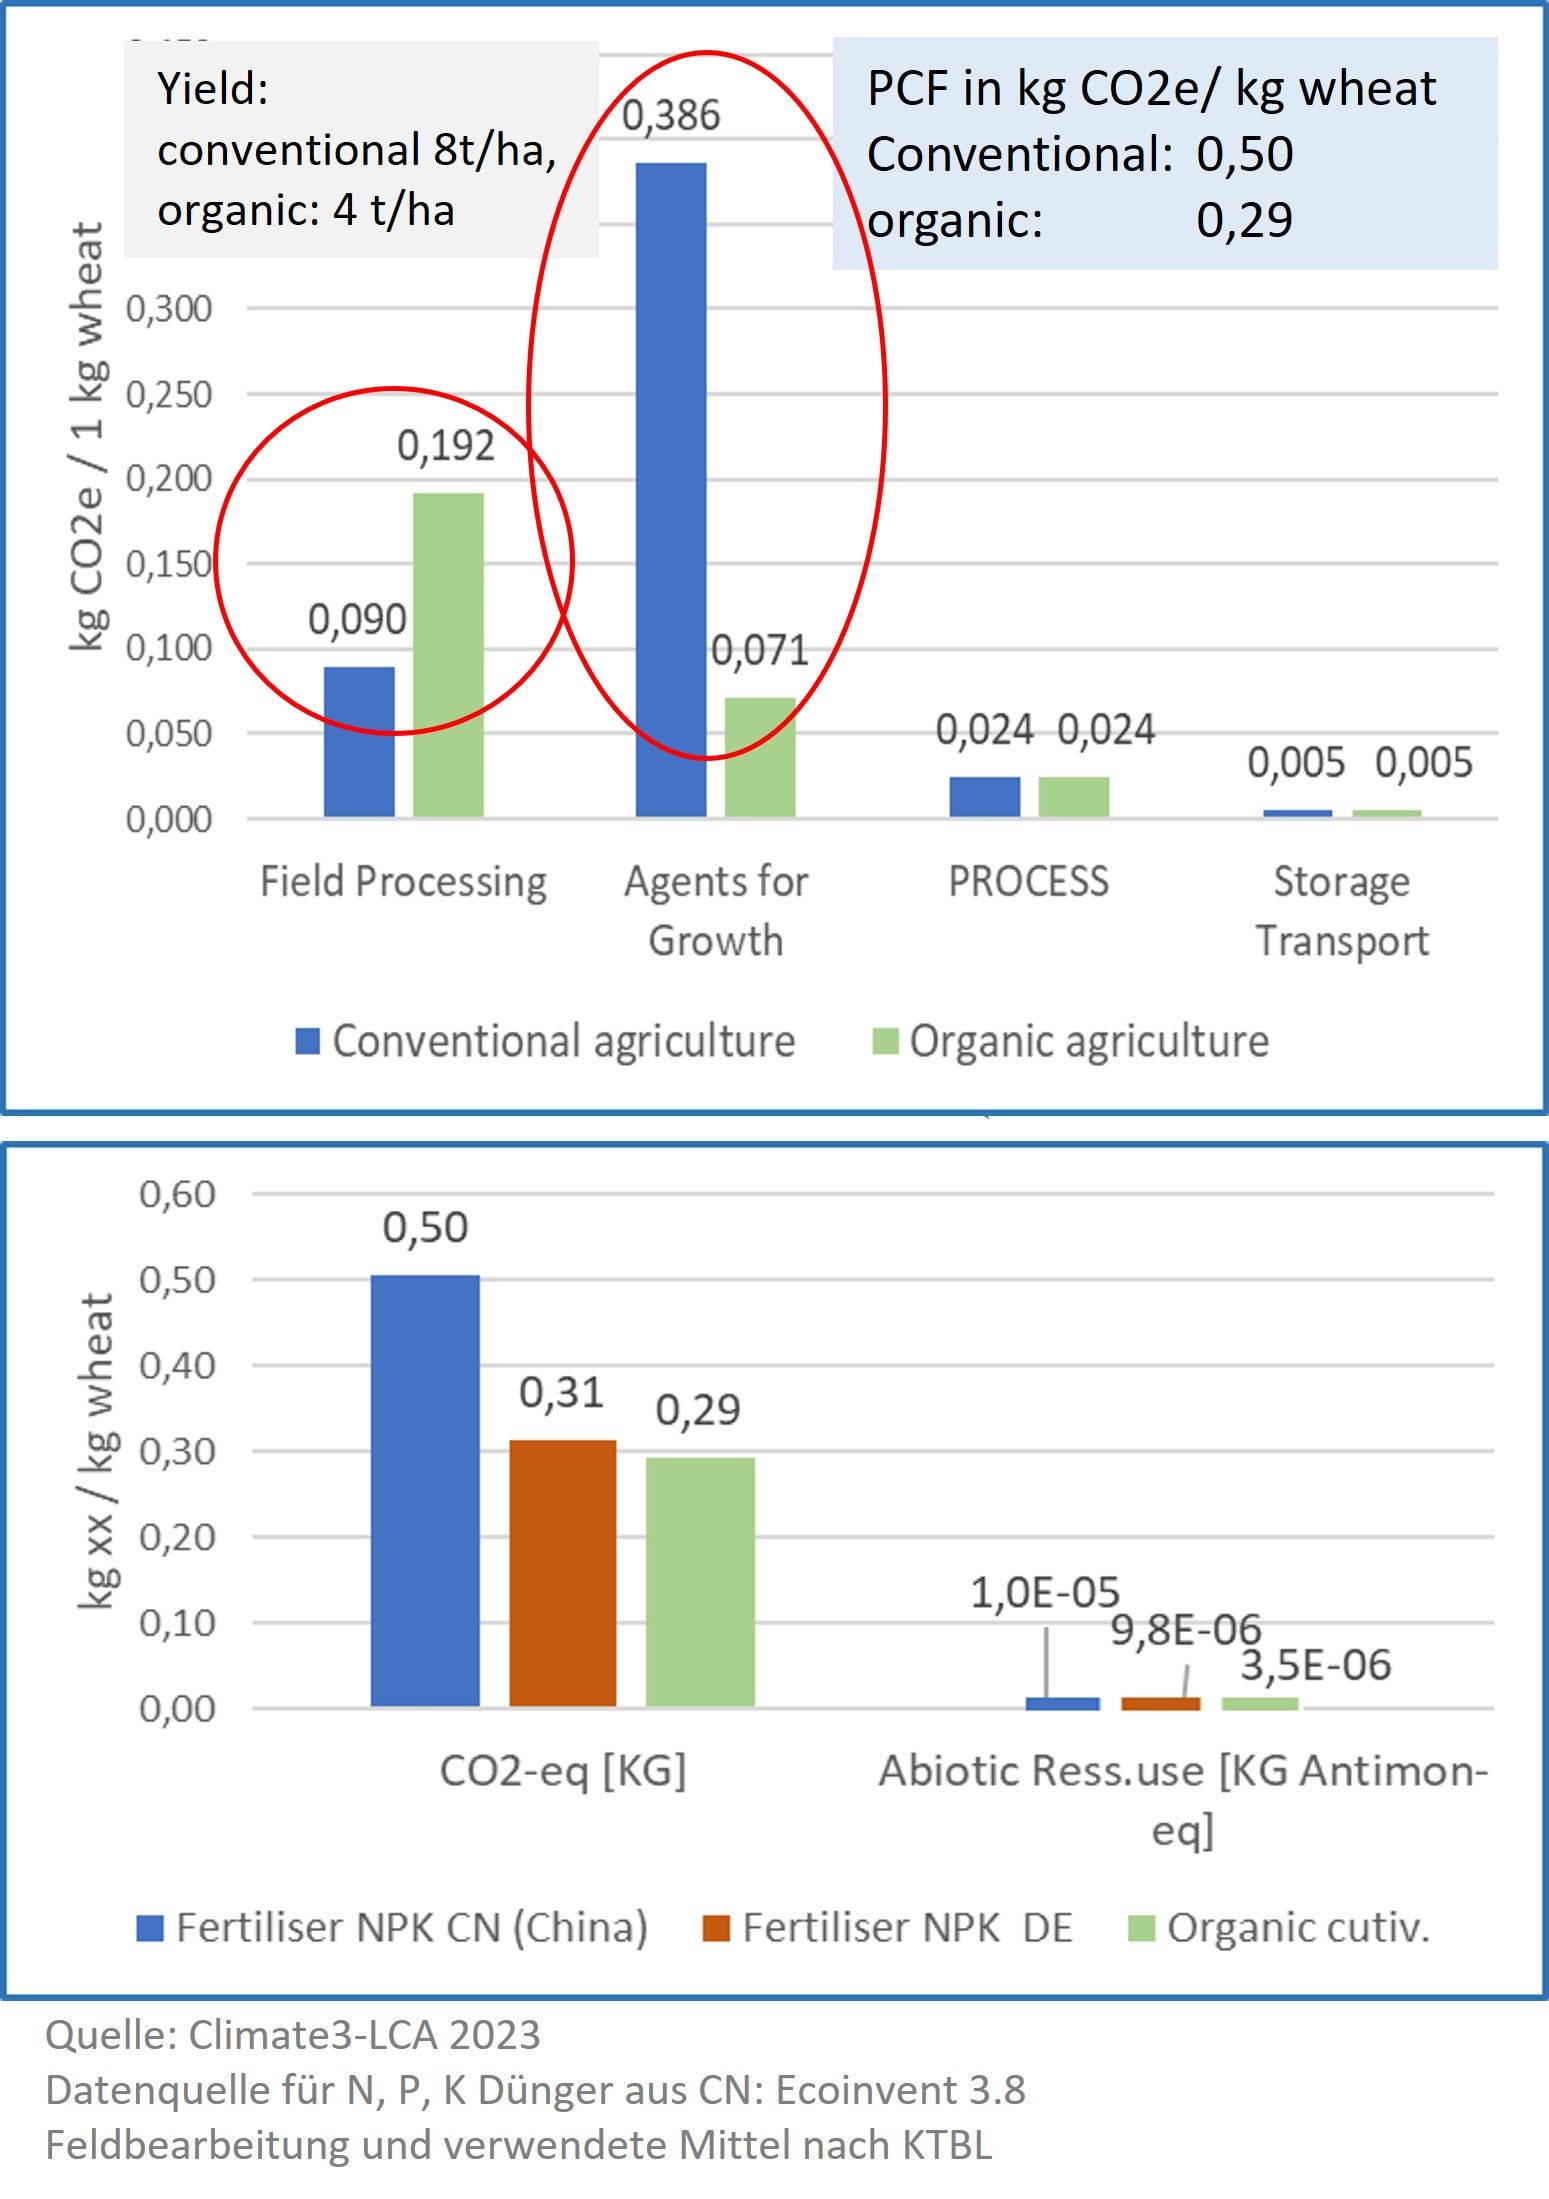
Calculation in agriculture using the example of wheat
Climate3 has extensive expertise in agricultural calculations. The comparison between conventional and organic wheat cultivation was based on this.
Two differences in the bars are noticeable in the graph above:
- Field cultivation in organic farming causes significantly more CO2e due to diesel consumption. The reason for this is the use of mechanical weed control.
- Conventional cultivation is approx. 5 times worse in terms of the means used for growth
The sensitivity calculation with a different reference for NPK fertiliser is interesting (chart below). Normally, farmers obtain these fertilisers from China (or Russia) with the result of 0.5 kg CO2e/kg wheat. If NPK fertilisers from Germany are used for cultivation, the PCF value improves from 0.5 to 0.31 kg CO2e/kg.
The result is all the more surprising in that the last PCF value is close to the PCF from organic cultivation. This is even more positive, as the yield in conventional cultivation is always 8 tonnes/ha. In organic cultivation, the yield is only approx. 4 tonnes/ha, which can be a problem in view of the need to feed the world's population.
Primary data in Climate3-LCA
Data for various processes can be found in different databases. This is always generally valid information. "If necessary, this data can be used in calculations, but if reduction projects are involved, primary data should be favoured.
This can be seen in the example of the comparison of emissions from transport based on Ecoinvent and actually determined values. The blue bars show the range for possible real transport expenditures, which can deviate up to 3-fold.
Climate3-System uses primary data from the customer. These are determined using special algorithms.
